TEST PRINCIPLE
Determination of the firmness and crunchiness of treated and untreated cashew nut samples by shearing using a Craft Knife Adapter (TA-CKA) fitted to a CTX Texture Analyzer.
BACKGROUND
The cashew nut, or simply called cashew, is widely consumed. The cashew can be eaten on its own, used in recipes, or processed into cashew cheese or cashew butter.For this test, cashews were separated into two groups, treated cashew and untreated cashew, each in its original packaging. A CTX Texture Analyzer with a 10 kg load cell was used with a TA-CKA Fixture to compress the blade and shear into the cashew test samples to a set distance. The amount of force required to shear the samples is then measured.The cashew samples are placed between the TA-CKA probe and the Fixture Base Table (TA-BT-KIT). As the probe is slowly lowered onto the sample, it will break the surface and cut into the cashew. This will provide data on the firmness and crunchiness of the cashew.
METHOD
| Equipment: |
CTX with 10 kg Load Cell (XCTX) |
|
Fixture Base Table (TA-BT-KIT) |
|
Craft Knife Assembly (TA-CKA) |
|
Texture Pro Software (SWL-02-111) |
Settings:
| Test Type: |
Compression |
| Test Speed: |
1.0 mm/s |
| Target Type: |
Distance |
| Target Value: |
5 mm |
| Trigger Load: |
50 g |
SAMPLE PREPARATION
Cashews were separated into two groups, treated and untreated in its original package for 48 hours at room temperature, before testing.
PROCEDURE
- Attach the TA-CKA probe to the CTX Texture Analyzer.
- Insert two table bolts into slots on the analyzer base.
- Place the Fixture Base Table on CTX, and lightly screw the bolt nuts.
- Adjust the table so the probe is centered on the table.
- Once alignment is complete, secure base table by tightening the bolt nuts. Place the white cutting base on the base table.
- Place sample on the table. Align the sample under the probe at the center.
- Position probe to about 5 mm above the sample.
- Set the test parameters using the Texture Pro software.
- Commence test.
- Repeat steps 1-9 for all test samples.
OBSERVATION
When a trigger load of 50 g is detected at the sample surface, the probe compresses and shears the cashews at a test speed of 1 mm/s over a specified distance of 5 mm. Once the 5 mm distance is met, the probe returns to the starting position. The load vs. time graph (Fig. 6) indicates a typical cashew sample hardness and fracturability. The load vs. distance graph (not shown) indicates the work done on the sample to compress and cut into it.The cashews were tested five times, and these tests were averaged together. The graphs and table below report data concerning these averages.
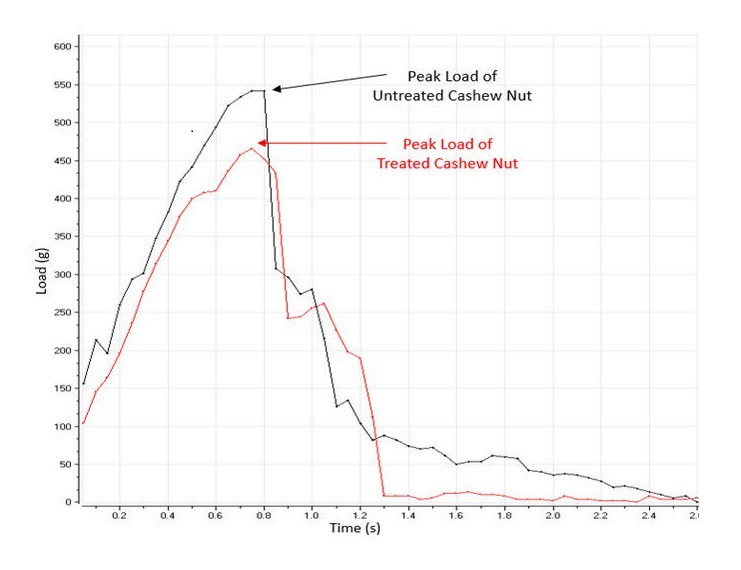
Typical graph plot between Treated vs. Untreated Cashew nut samples.
The axes are Load (g) vs. Time (sec)
DISCUSSION
The maximum force value is the peak load, which is a measure of sample firmness. The higher the maximum force value, the firmer the sample is. More work is required to fracture the sample. Hardness indicates the maximum force required to compress a food between molar teeth, while Hardness Work Done is the necessary work taken to chew the food. A fracture occurs when there is a sharp decrease in load. Quantity of fractures provides a strong indication of sample crunchiness by measuring the number of fractures during the first compression stroke. Only one compression stroke was used in this test. Quantity of fractures corresponds to the crunchiness of the cashew by indicating its brittleness.
DATA REPORT
Texture Pro Software is used to program and control the CTX during experimental tests. It automatically measures peak load values and calculates the quantity of fractures and other characteristic properties. Untreated cashew nut is harder, as it needed an average of 548 g force to shear. Softer, treated cashew nut sample needed only 460 g force. The table below shows that untreated cashews were harder and required more work than treated cashews. However, treated cashews have a higher number of fractures than untreated cashews. A lower number of fractures, which translates into crunchiness in untreated cashews, could be due to more moisture content or lack of drying time in the oven.
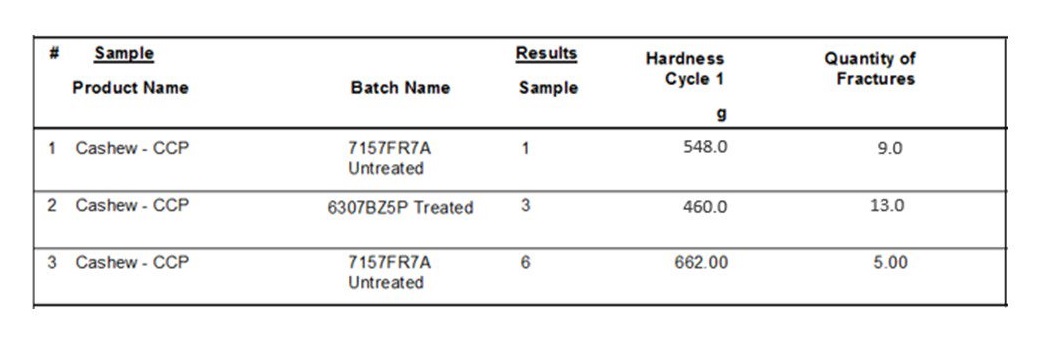
Test averages of Untreated and Treated Cashew Nut samples
CONCLUSION
The test results can be used to determine the ideal hardness and crunchiness of cashew nuts. Test procedure, sample preparation, and equipment setup must be adhered to for reproducible test results.
>>Download pdf of this application note.