NOTE: Adaptation of AACC 74-10A compression test for evaluating freshness of sliced white loaf.
TEST OBJECTIVE
Measurement of bread firmness as an indication of freshness vs. staling.
TEST PRINCIPLE
A single slice of 25 mm or two slices of 12.5 mm in thickness are placed under a 38.1 mm diameter cylindrical probe. The bread is compressed 3 mm and peak load is used as an indication of freshness. In addition, the sample may be compressed to a certain load. The distance traveled to achieve that load is compressibility, which is an indication of softness.
BACKGROUND
The original AACC method for bread compressibility specifies an apparatus known as the Baker Compressimeter, which quantifies the compressibility of a bread sample. The test is based on the theory that peak load increases and compressibility decreases as the bread ages.
This adapted method of bread compression not only provides valuable information relating to product staling, but also can provide an invaluable indication of textural differences arising from ingredient and formulation manipulation.
METHOD
Test sample is placed on table with side toward center of loaf facing up. Center sample under probe. During test compression load sensed by a 38.1 mmØ Perspex cylinder (TA-4) probe is continuously recorded via software.
Settings:
| Mode: |
Compression |
| Pilot: |
Peak |
| Test Speed: |
1.0 mm/s |
| Distance: |
3 m/m |
| Option: |
Normal |
| Trigger : |
Auto 4 g Trigger |
READING
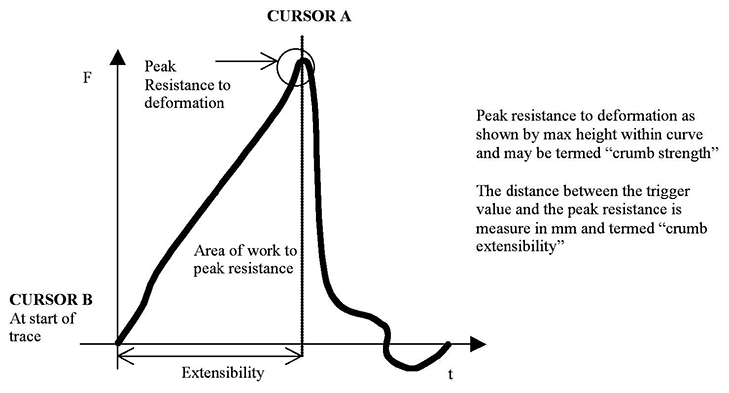
Figure I
PARAMETERS
Crumb Strength: Peak resistance to deformation
Crumb Extensibility: Distance between trigger point and peak resistance
Crumb Work: Area between trigger point and peak resistance
| RESULTS |
Day 1 |
| Crumb Strength: |
483 g |
| Crumb Extensibility: |
21.2 mm |
| Crumb Work: |
4273.7 gs |
EMPIRICAL FACTORS
Test conditions that will affect results generated:
1. Sample size
2. Sample age
3. Sample container and/or test probe employed
4. Sample positioning and centralization
Sample conditions that will affect results generated:
1. Formulation and composition
2. Bake or process treatments
3. Sample storage and exposure
RELATED TESTS
TPA type assessment of bread sample
Adaption of AACC Method (74-09) for Bread Firmness
Stress relaxation as an indicator of bread staling
DISCUSSION
Observations from the trace give a good indication of bread quality. Results over a staling period have shown greatest and most significant difference between samples within crumb extensibility and area of work to peak deformation. Peak values for crumb strength were shown to illustrate some inconsistency, which may affect the significance of the test data attained. The test procedure determined elasticity and break characteristics of the samples evaluated as well as generating an indication crumb strength representative of product consistency.
Further work with breads of known formulation is recommended under controlled conditions to illustrate the potential for application of such tests within a quality or production environment.
CONCLUSION
This method is very simple to follow and provides valuable data related to both the staling and compositional properties of bread. The method can therefore be incorporated within both quality and development programs as a means of optimizing product quality. In addition correlating data generated with perceived sensory characteristics extends the value of such tests further.
_________________
REFERENCES:
Dahle, L. and Sambucci, N. 1987. Application of Devised Universal Testing Machine Procedures for Measuring the Texture of Bread and Jam Filled Cookies. American Association of Cereal Chemists, Inc. 32, No.7, 466-470.